Last week I ran into a problem at work when debugging, where autos and locals windows showed up but there was nothing there. I put a breakpoint and attached to a process to debug my web application as usual. However after the symbols loaded and hit the target breakpoint, the following happened.
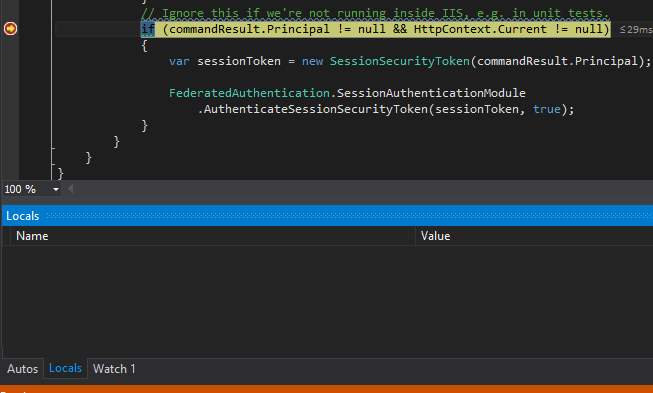
No locals shown in the Locals Window
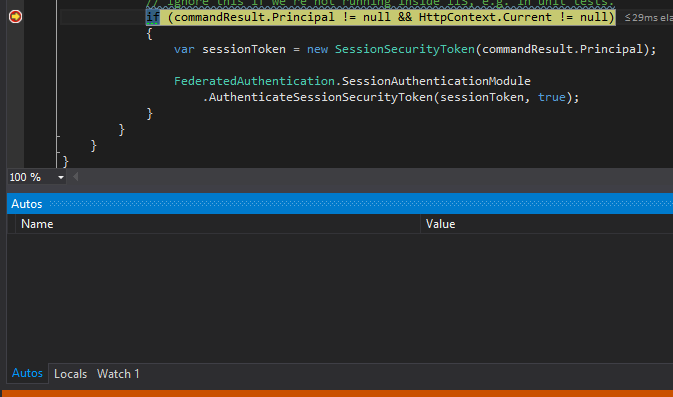
No autos shown in the Autos Window
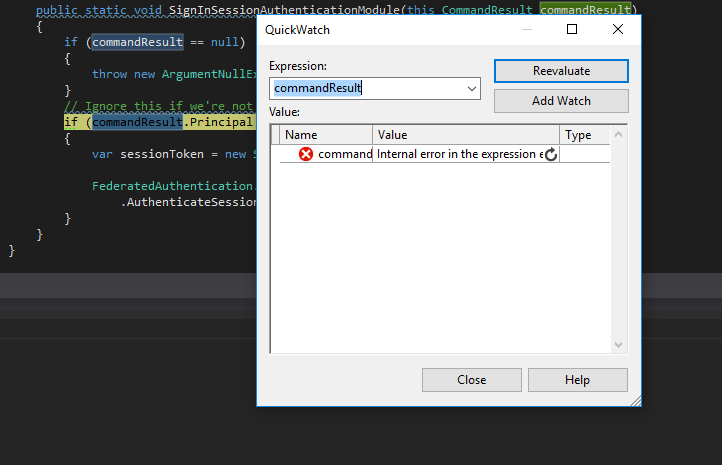
I then tried a quick watch on a variable to see if it worked. It threw an “Internal error in the expression exception”.
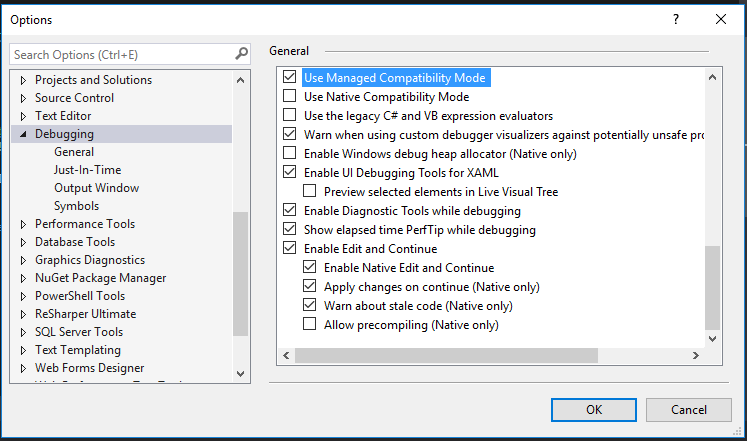
As workaround for this, I had to turn on “Use Managed Compatibility Mode” in Tools -> Options -> Debugging -> General.
The locals then showed up when it hit the breakpoint as seen below
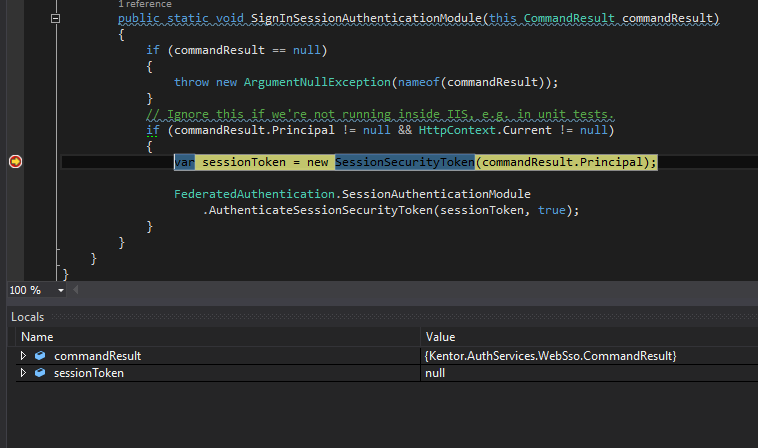
This fix is however just temporary as it will result in different debugger behaviour. This is because turning on this option will switch back to the legacy debug engine. Usually, you ONLY want to turn this option on if you are working on a mixed mode application (managed C++, see more details here.)
It is still unclear what caused this issue as my applications use C# and VB. Some of my colleagues suggest that somehow the debug breakpoint might be corrupted after we move from TFS to Git. However, this only happened on my machine at work and I have not been able to reproduce it anywhere else. I also recently (and finally) upgraded my machine at work to Windows 10. I suspect it might also be the cause as everything was fine before the upgrade.

Awesome post.
Hi
I had the same issue trying to build a simple console app to process a SVG document (same result with any windows type app). I am on the latest Visual Studio 15 update 3 but also have just installed the latest Xamarin.
I have done a complete reinstall of VS, cleared everything other than registry setting and the problem persists unless you check the legacy debug option.
Thanks for your post
Andrew
Spot on with this write-up, I honestly feel this website needs much more attention. I’ll probably be
returning to read more, thanks for the information!
hi,thanks, it’s working for (desperate) me